
Average Score
Total Votes
Select your score (1-10):
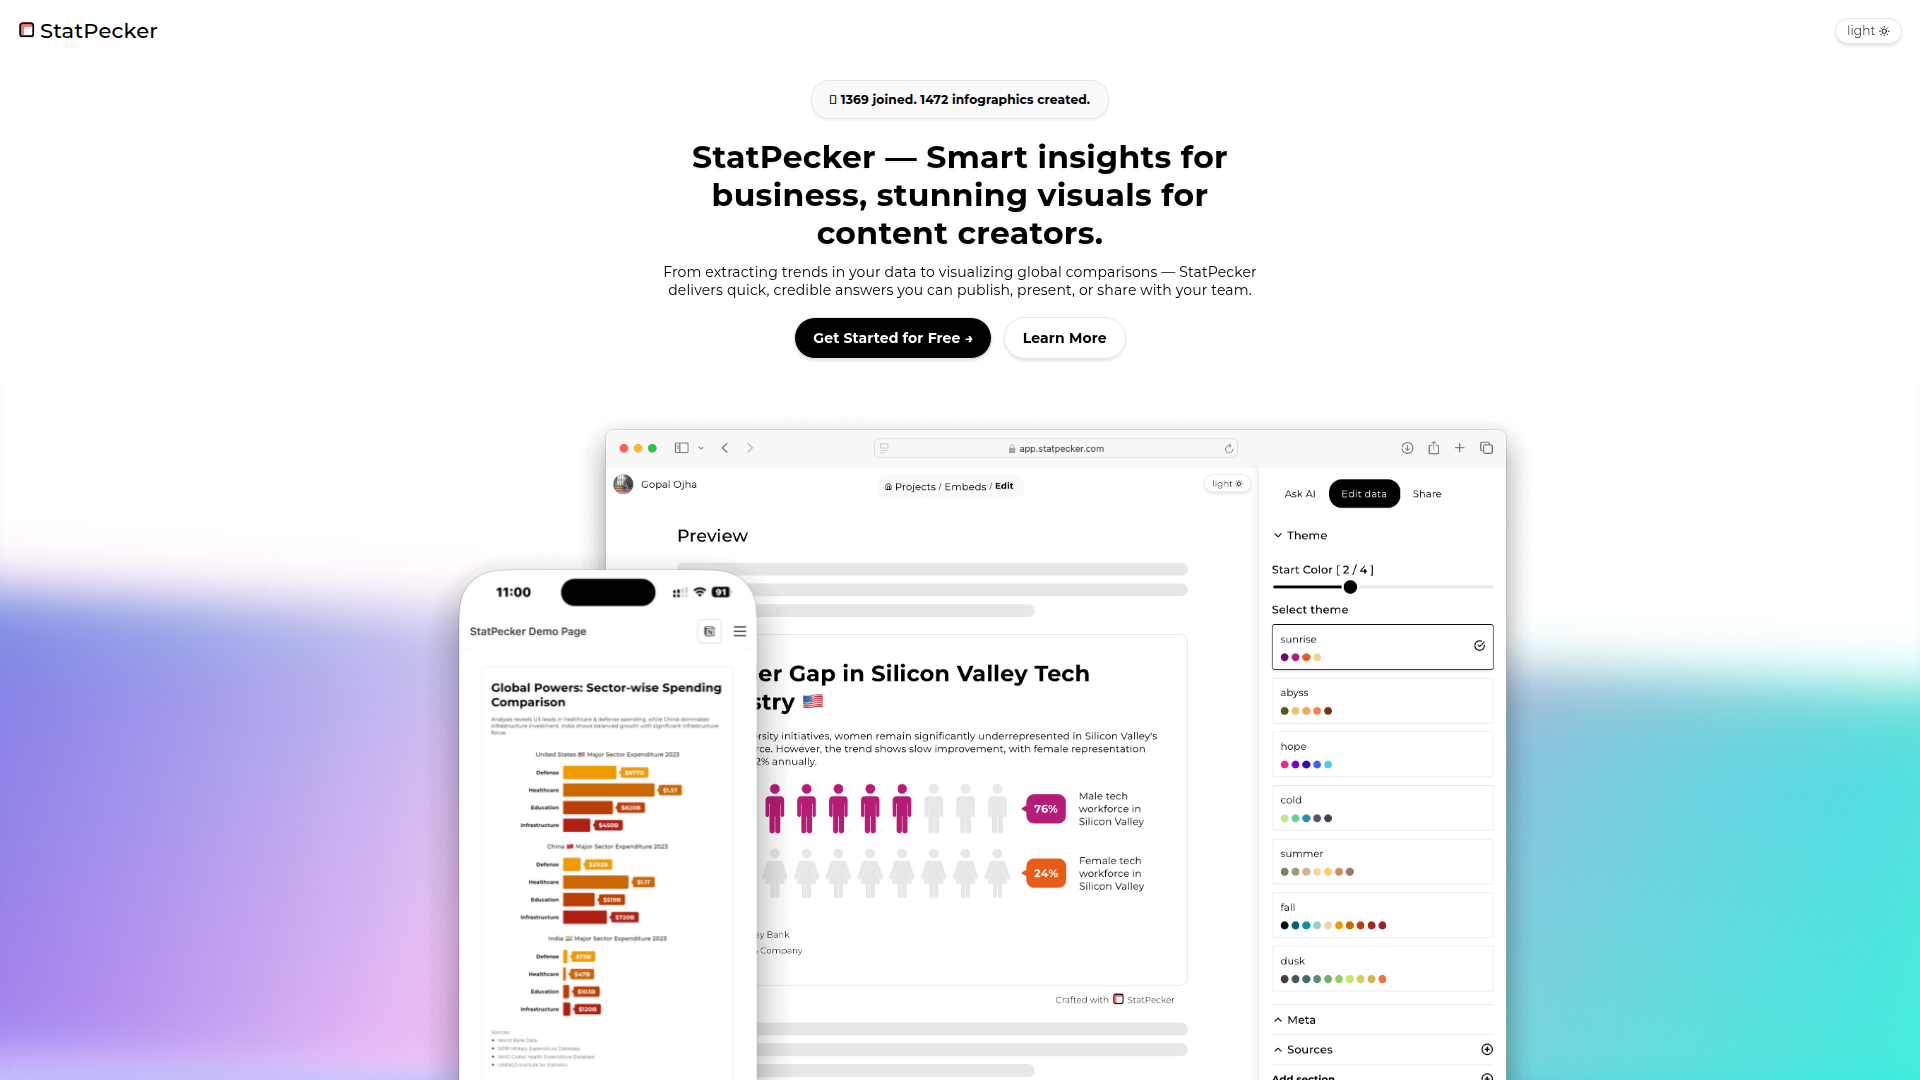
StatPecker is an AI-assisted data insight and infographic creation tool for business users, content writers, and data analysts who need fast answers and publishable visuals. It combines question-based analysis, source-backed insights, CSV exploration, and exportable graphics in one lightweight workflow.
The product appears positioned as an accessible alternative to more complex analytics and visualization tools, with an emphasis on speed, ease of use, and content-ready output. A notable capability is its Local SQL Agent, which lets users upload a CSV file and analyze it on-device, helping teams explore private data while producing charts they can share, embed, or download.
StatPecker could likely work well inside the OpenClaw ecosystem as a data-storytelling and lightweight analytics layer. Likely skill designs include an agent that accepts CSV uploads, generates stakeholder-specific summaries, proposes chart options, and packages results into publishable assets for marketing, research, or operations teams. Another likely workflow is a content intelligence skill that converts a business question into a sourced insight brief plus an embeddable visual for articles, newsletters, or landing pages.
For analysts, content teams, and operators, this combination could reduce the gap between analysis and communication. In a likely OpenClaw implementation, one agent could inspect a dataset, a second could draft narrative takeaways, and a third could prepare visuals and embed-ready snippets for CMS publishing. While the source page does not confirm any native OpenClaw integration, StatPecker’s query-to-visual workflow makes it a strong candidate for agent-driven reporting, internal brief generation, and scalable data-backed content production.
Share this AI tool on your website or blog by copying and pasting the code below. The embedded widget will automatically update with the latest information.
<iframe src="https://aimyflow.com/ai/app-statpecker-com-welcome/embed" width="100%" height="400" frameborder="0"></iframe>
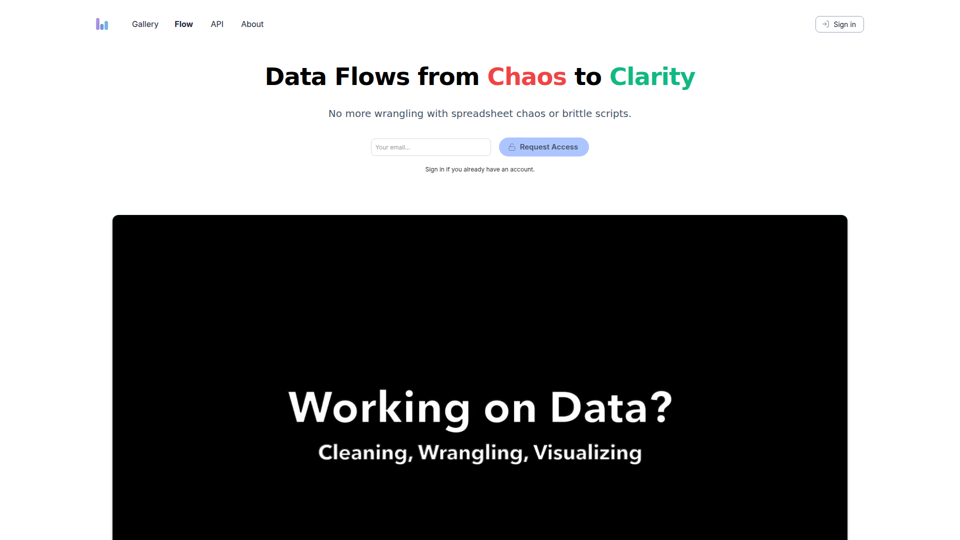
Columns Flow is a data workflow tool that helps spreadsheet users, analysts, engineers, and managers turn connected data sources into visual reports, automated updates, alerts, and shareable summaries using plain-language transformations. For data and operations teams, it can reduce manual wrangling and brittle scripts while keeping reporting and downstream handoffs more consistent in AI-assisted workflows.
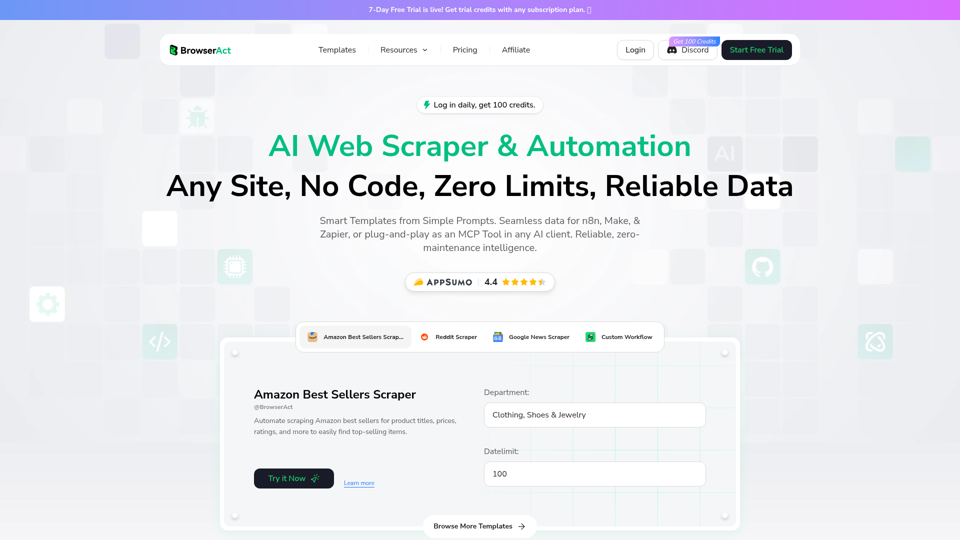
BrowserAct is an AI-powered no-code web scraper and browser automation tool that helps users extract website data and build automated workflows from natural language prompts, mainly for operations teams, analysts, and developers. In AI-driven data workflows, it can reduce manual scraping upkeep by turning websites into reusable automation steps for research, monitoring, and system-to-system data handling.
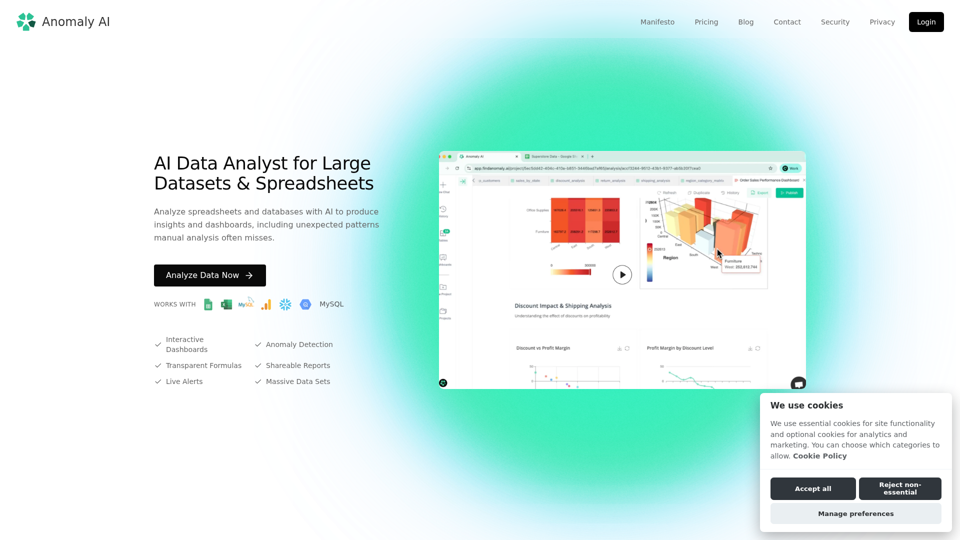
Anomaly AI is an AI data analyst for large datasets and spreadsheets that helps teams analyze Excel, Google Sheets, BigQuery, and databases to generate insights, dashboards, and anomaly detection, mainly for spreadsheet-oriented business and analytics teams working beyond Excel’s limits. In AI-driven analytics workflows, it can help analysts, operations, finance, and product teams verify metrics faster and surface patterns or risks that manual review may miss.
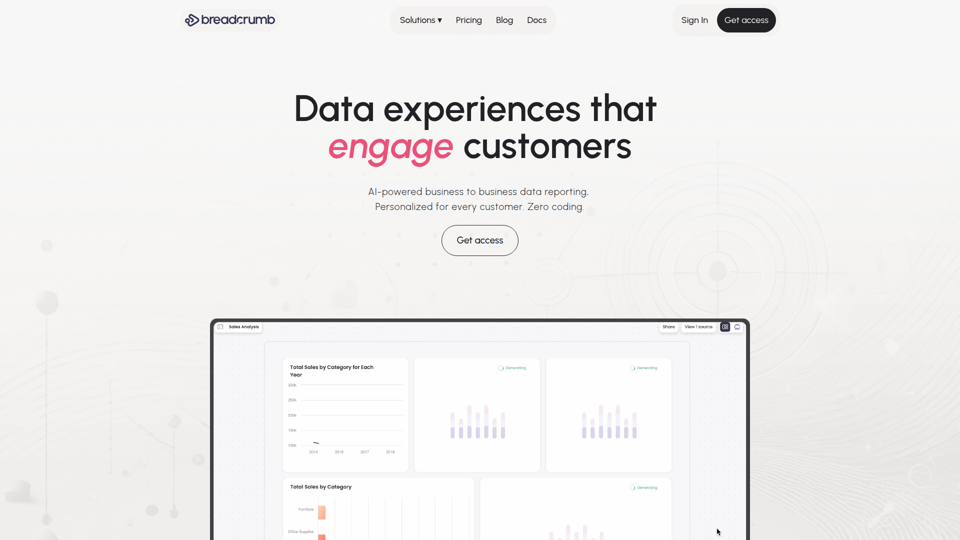
Breadcrumb.ai is an AI-powered customer reporting and analytics platform that helps users combine, analyze, visualize, and embed data into personalized reports without coding, mainly for managers, teams, consultants, and agencies serving multiple stakeholders or clients. In AI-driven reporting workflows, it can reduce manual back-and-forth for client services, operations, and revenue teams by automating data preparation and enabling self-serve insights through conversational reports.
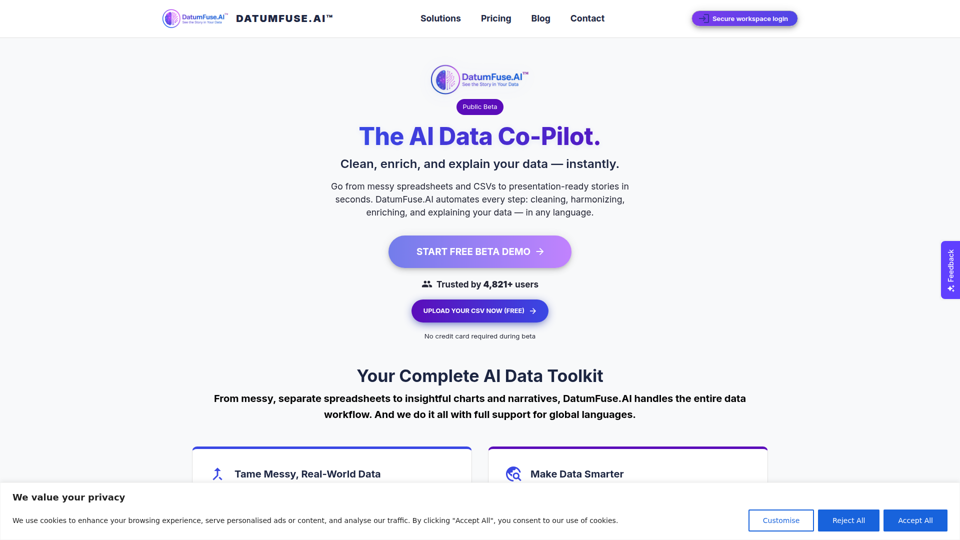
DatumFuse.AI is an AI data platform that helps users clean, harmonize, augment, visualize, and narrate spreadsheet and CSV data, mainly for teams and professionals working with messy business datasets. For marketers, operations teams, consultants, and presenters, it can reduce manual data wrangling and speed up turning exports into clearer charts, summaries, and decision-ready reports.
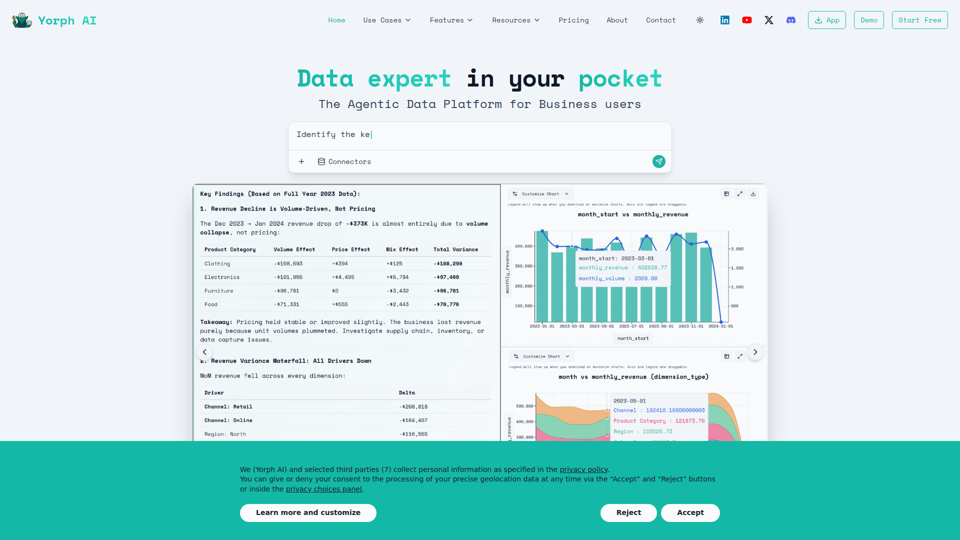
Yorph AI is an agentic data platform that helps business users and analytics teams sync, transform, analyze, and visualize data through reusable pipelines, semantic layers, and plain-language queries. For analysts, FP&A, product, and operations teams, it can reduce manual data wrangling and speed explainable, validated analysis for faster decision-making.
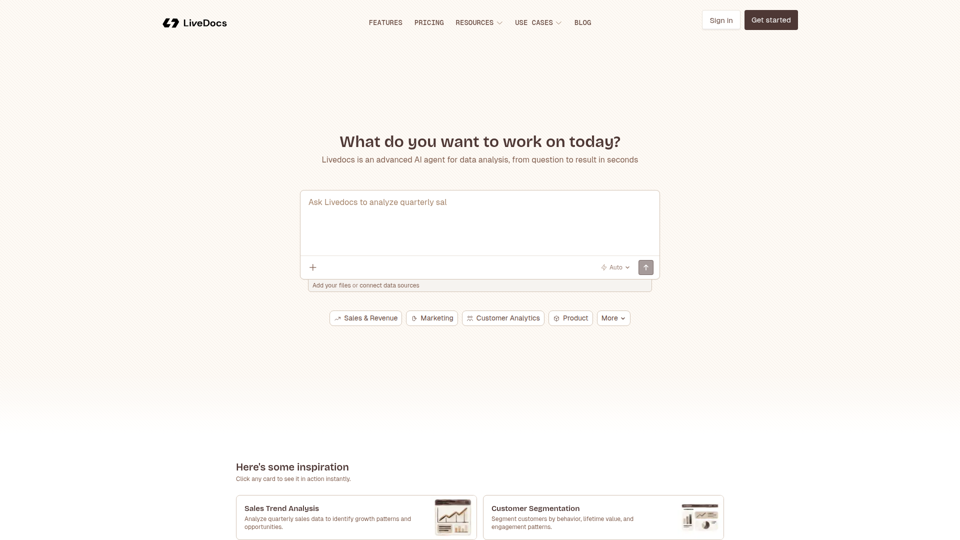
Livedocs is an AI data analysis agent that helps users analyze datasets, generate SQL queries, build dashboards, and uncover insights quickly, mainly for teams working in sales, marketing, customer analytics, product, and related data functions. In AI-driven workflows, it can help analysts and operations teams move faster from raw data to decisions by automating common exploratory and reporting tasks.
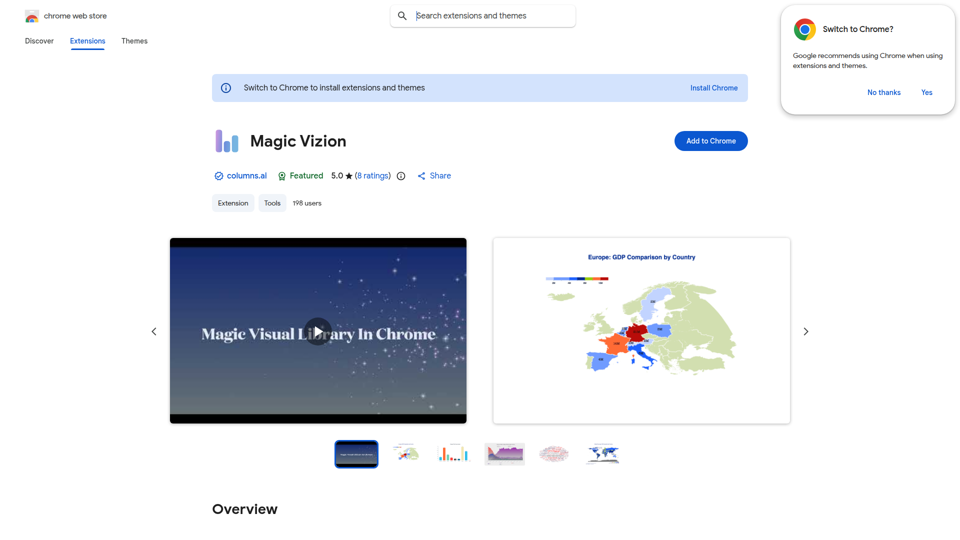
Magic Vizion is a Chrome extension from Columns.ai that helps users turn highlighted web text, paragraphs, and tables into interactive data visualizations, mainly for researchers, analysts, and students. In AI-assisted research and analysis workflows, it can help these professionals convert unstructured web content into clearer charts faster for review, customization, saving, and sharing.