
Average Score
Total Votes
Select your score (1-10):
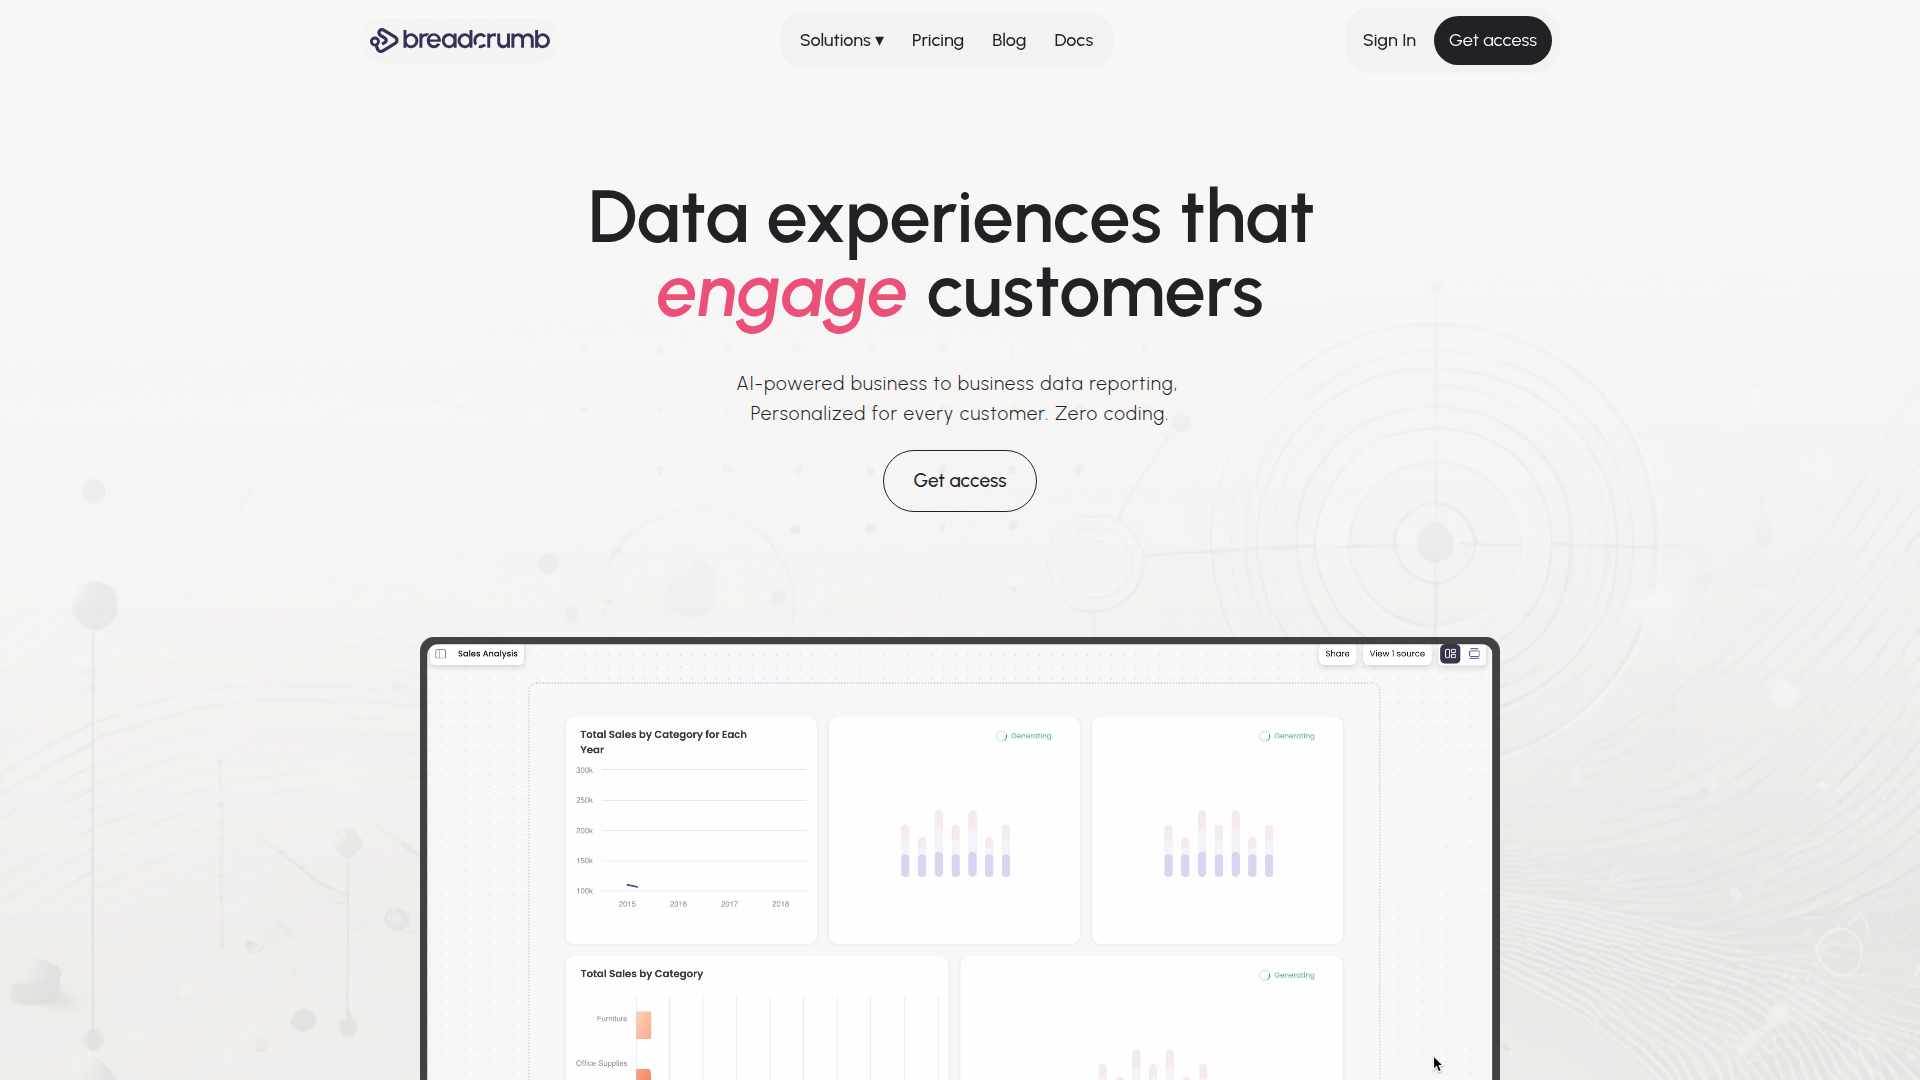
Breadcrumb.ai is an AI-powered B2B reporting platform for turning business data into customer-facing and internal data experiences. It is designed for organizations that need to deliver personalized analytics at scale, including managers, teams, consultants, agencies, and businesses serving multiple clients, departments, or stakeholders.
The product’s workflow appears to cover data aggregation, cleaning, transformation, ingestion, modeling, analysis, visualization, and report delivery in one no-code environment. Its positioning is likely as a reporting and embedded analytics platform that reduces manual reporting work while making dashboards and reports more interactive through plain-language querying and chat-based exploration.
Breadcrumb.ai could likely fit into the OpenClaw ecosystem as a reporting, analytics delivery, and stakeholder communication layer. A likely OpenClaw use case would be agents that collect operational data from business systems, normalize it, pass it into Breadcrumb-style reporting workflows, and then generate account-specific dashboards, narrative summaries, or partner-ready data experiences. The site does not confirm native OpenClaw integration, so this should be treated as a workflow design possibility rather than a documented capability.
In practice, OpenClaw skills could be built for recurring client reporting, revenue performance briefings, event monitoring summaries, partner health updates, or embedded analytics distribution across customer portals. For agencies, consultants, and operations teams, that combination could shift work away from manual report assembly toward exception monitoring, insight review, and strategic follow-up. The likely industry effect is a move from static reporting operations to agent-assisted analytics delivery that is more conversational, repeatable, and scalable across many accounts.
Share this AI tool on your website or blog by copying and pasting the code below. The embedded widget will automatically update with the latest information.
<iframe src="https://aimyflow.com/ai/breadcrumb-ai/embed" width="100%" height="400" frameborder="0"></iframe>
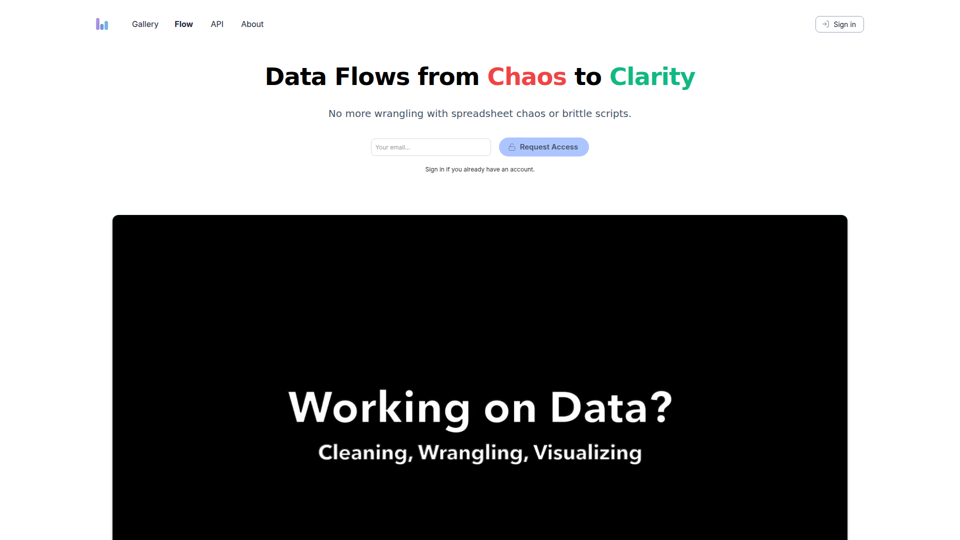
Columns Flow is a data workflow tool that helps spreadsheet users, analysts, engineers, and managers turn connected data sources into visual reports, automated updates, alerts, and shareable summaries using plain-language transformations. For data and operations teams, it can reduce manual wrangling and brittle scripts while keeping reporting and downstream handoffs more consistent in AI-assisted workflows.
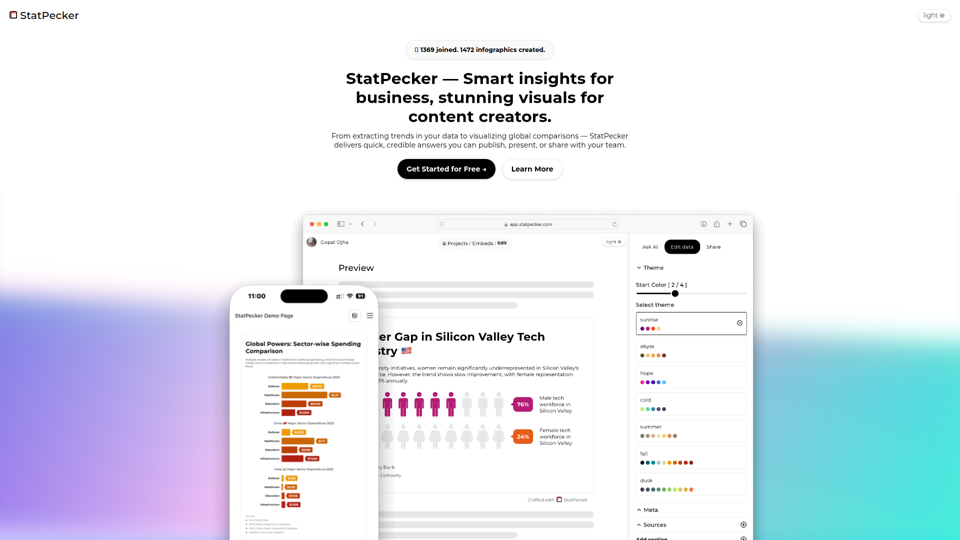
StatPecker is an AI data insight and visualization tool that helps users ask questions about data, analyze local CSV files privately on-device, and create publishable charts and infographics, mainly for content writers and data analysts. In AI-assisted content and reporting workflows, it can help analysts and writers turn raw data into credible visuals faster for articles, presentations, and team sharing.
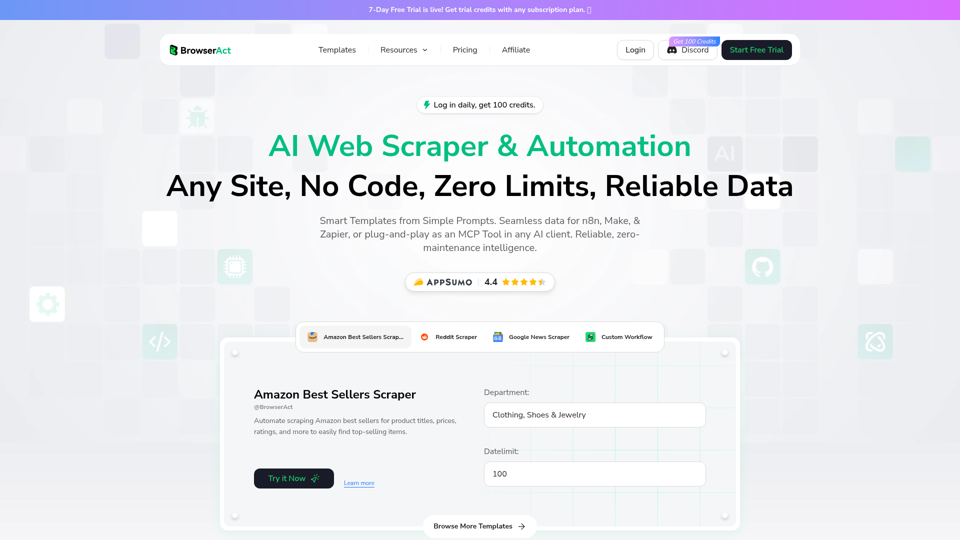
BrowserAct is an AI-powered no-code web scraper and browser automation tool that helps users extract website data and build automated workflows from natural language prompts, mainly for operations teams, analysts, and developers. In AI-driven data workflows, it can reduce manual scraping upkeep by turning websites into reusable automation steps for research, monitoring, and system-to-system data handling.
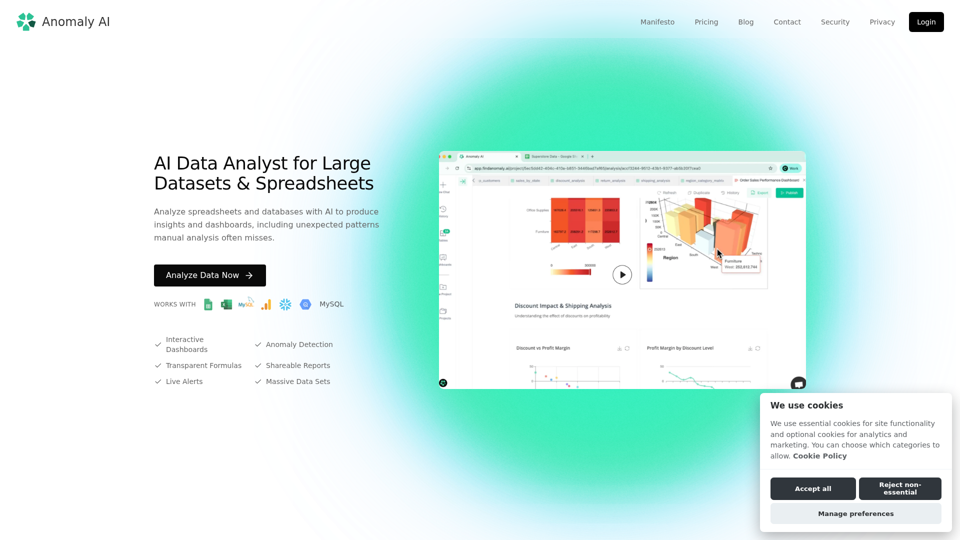
Anomaly AI is an AI data analyst for large datasets and spreadsheets that helps teams analyze Excel, Google Sheets, BigQuery, and databases to generate insights, dashboards, and anomaly detection, mainly for spreadsheet-oriented business and analytics teams working beyond Excel’s limits. In AI-driven analytics workflows, it can help analysts, operations, finance, and product teams verify metrics faster and surface patterns or risks that manual review may miss.
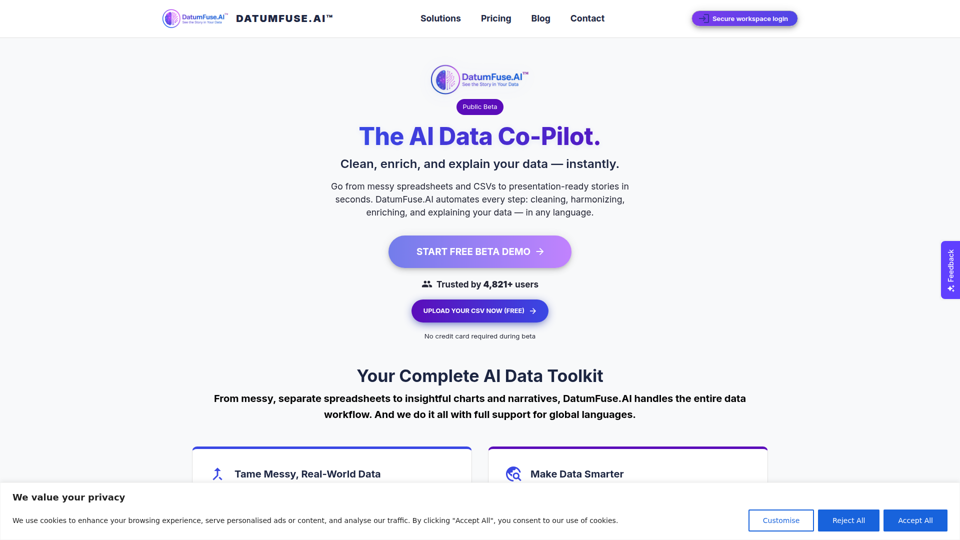
DatumFuse.AI is an AI data platform that helps users clean, harmonize, augment, visualize, and narrate spreadsheet and CSV data, mainly for teams and professionals working with messy business datasets. For marketers, operations teams, consultants, and presenters, it can reduce manual data wrangling and speed up turning exports into clearer charts, summaries, and decision-ready reports.
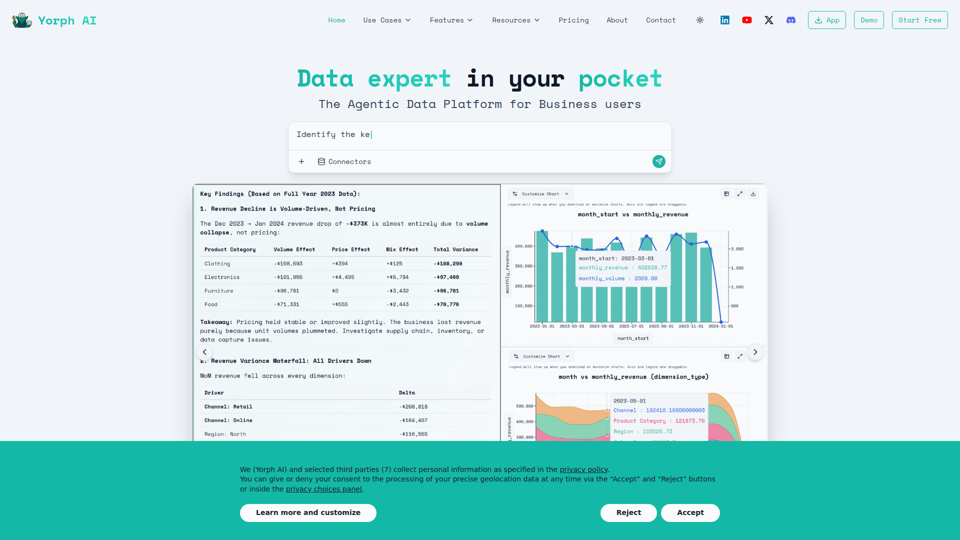
Yorph AI is an agentic data platform that helps business users and analytics teams sync, transform, analyze, and visualize data through reusable pipelines, semantic layers, and plain-language queries. For analysts, FP&A, product, and operations teams, it can reduce manual data wrangling and speed explainable, validated analysis for faster decision-making.
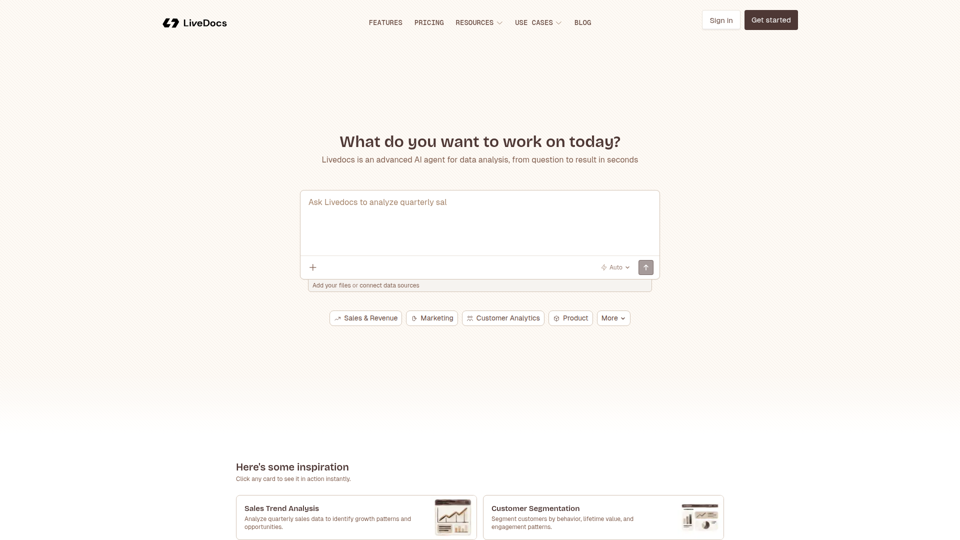
Livedocs is an AI data analysis agent that helps users analyze datasets, generate SQL queries, build dashboards, and uncover insights quickly, mainly for teams working in sales, marketing, customer analytics, product, and related data functions. In AI-driven workflows, it can help analysts and operations teams move faster from raw data to decisions by automating common exploratory and reporting tasks.
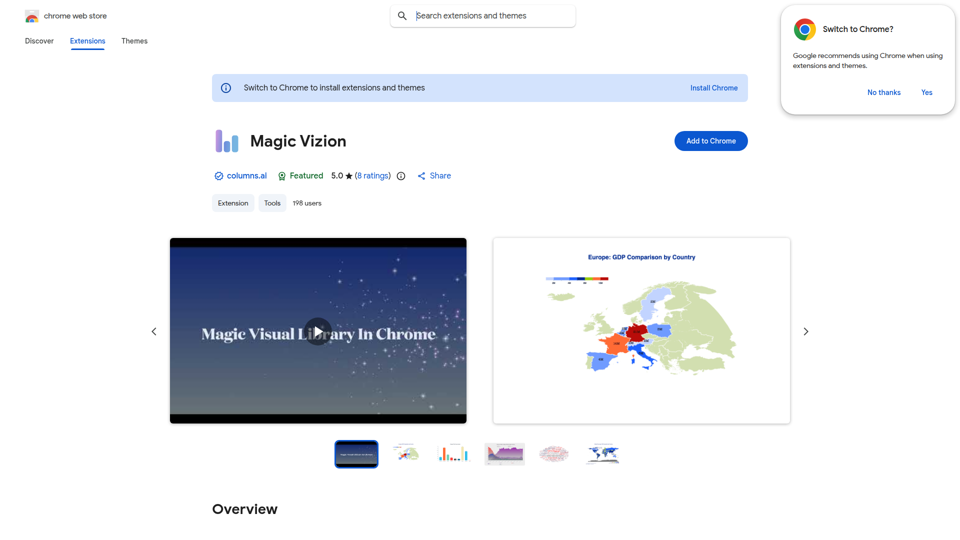
Magic Vizion is a Chrome extension from Columns.ai that helps users turn highlighted web text, paragraphs, and tables into interactive data visualizations, mainly for researchers, analysts, and students. In AI-assisted research and analysis workflows, it can help these professionals convert unstructured web content into clearer charts faster for review, customization, saving, and sharing.